InInternal rotation of the Sun
 To Credit : NASA
One can easily observe that the surface of the Sun rotates, by looking for instance at the movement of sunspots over the solar disc day after day.
We see that the surface of the Sun does not rotate with the same velocity everywhere : the poles take more than 30 days for one revolution, while the equator takes about 25 days.
However, how can we probe the rotation of the solar interior?
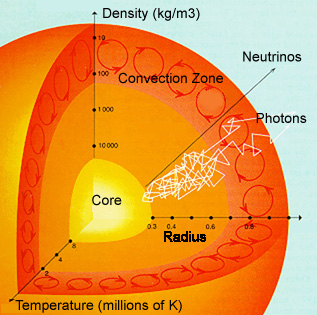
Heliosismology uses the oscillations of acoustic waves that propagate inside the Sun to get precious informations about its internal structure and to infer its rotation profile.
From the analysis of data from the GOLF/Solar and Heliospheric Observatory (SOHO) and the MDI/SOHO, statistically significant information about the rotation of the deepest solar layers could be obtained.
A flat rotation profile down to 0.2 solar radius is deduced. Below 0.3 solar radius, uncertainties in the solar rotation rate are still quite large.
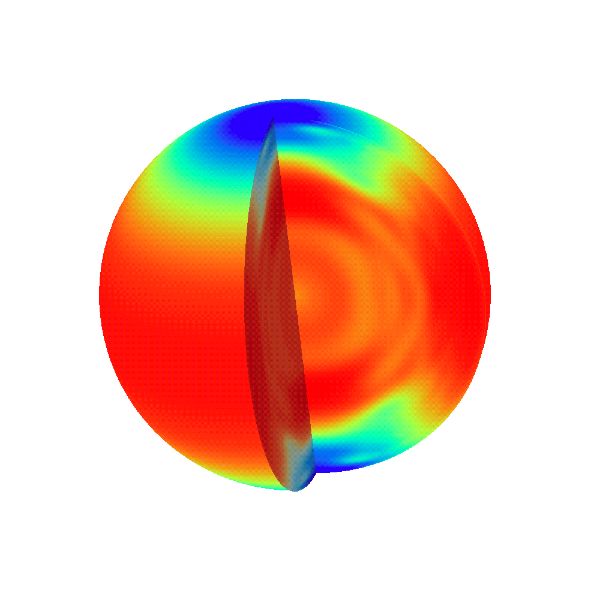
This figure shows rotation in a cross-section of the Sun. It is is based on frequency splittings obtained from the LOWL instrument. The colour coding gives the rotation period in days, as indicated on the scale to the right. The figure shows that the rotation rate varies with latitude in much the same way as on the surface, down to the dotted line. Inside this dotted line the rotation varies only very little.
The dotted line marks the boundary of the convection zone, where energy is transported through gas motion. The entire convection zone therefore rotates in much the same way that the surface does.
The transition at the boundary of the convective zone, to constant rotation, seems to be quite sharp.
From the figure it is also clear that we don't actually know much about the rotation in the central parts of the Sun. This we hope to learn much more about in the coming years, thanks to the new observations and also to the improved methods for analysing the results.
Credit (figure and text) : Jørgen Christensen-Dalsgaard and collaborators, University of Aarhus
Inferred rotation rate as a function of depth and latitude. Evidently the convection zone rotates uniformly along a radius with all depths showing the differential rotation seen at the surface. Below the convection zone is a layer of shear below which the radiative interior seems to rotate rigidly. This shear zone which coincides with the sound speed excess could be the region where the solar cycle dynamo operates.
Figure from Kosovichev et al. (1997)
Upper panel: Rotation profile directly derived with GOLF and MDI, combined with LOWL splittings for > 3.
Lower panel: Rotation profile obtained after correction of the splittings to account for the differential rotation in the convective zone. The vertical error bars result from propagating splitting measurement errors through the inversion process, while the horizontal error bars give the FWHMs of the corresponding averaging kernels, which is an estimate of the resolution achieved at each depth.
Figure and text from Couvidat et al. (2001)
This image, taken using the Michelson Doppler Imager (MDI) instrument on board the NASA/ESA Solar and Heliospheric Observatory (SOHO) spacecraft, shows differences in the speed of rotation of material in the Sun. This image is made from continuous observations over a period of twelve months beginning in May 1996. The false colors represent speed; red material is rotating the fastest, dark blue, the slowest. The left side of the figure is rotation speed at the surface of the Sun; red material at the equator is moving approximately three thousand miles per hour faster than the blue material at the poles. The cutaway on the right reveals rotation speed inside the Sun. The large dark red band is a massive fast flow of hot, electrically charged gas called plasma beneath the solar equator. This plasma stream is approximately 300 thousand miles wide and 130 thousand miles deep. This material moves about four percent faster than the surrounding material. Additionally, the newly discovered, but much more subtle, plasma streams can be seen in the cutaway at the poles. They are the light blue areas embedded in the slower moving dark blue regions. Although much smaller than the equatorial stream, they are still immense by terrestrial standards. Each stream is about 17,000 miles across, large enough to engulf two Earths. This material moves about ten percent faster than its surroundings. (Photo Credit: Stanford University) See also the SOHO/SOI-MDI results pages.