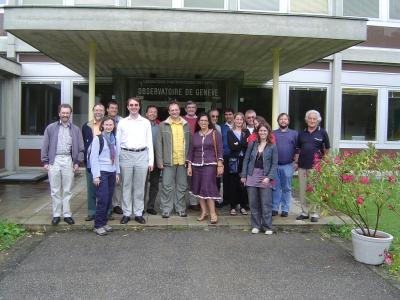

The presentation started by pointing out that the best place to get information was the web site http://obswww.unige.ch/~eyer/VSWG. A general description of what information was available was given and what recent changes had been made. The group has 45 members, of which half are active. The activities over the last six months were listed along with an organogram of a proposed data processing plan. This also showed some of the work/publications that people have carried out. A new tasks list was shown.
It was emphasized that the Gaia data reduction is a very big task.
If we assume 1 second of processing per star this implies 30 years of CPU
time. 100-200 Tbytes of data will be generated with a
database of order 1-2 Pbytes.
The description of what is required from the
variability processing is contained in GAIA-LL-044.
At the Cambridge meeting in 2004 it was decided to concentrate on just using
the G band for variability detection. In order to process the data
efficiently and continuously throughout the mission it was decided to use
cumulative formulations. The tests initially chosen were described.
Also a single period search algorithm was chosen (Lomb-Scargle) for the
first tests to
act as a benchmark that other period search methods could be compared
against.
This software was ready by September 2004 and has been used in the GaiaGrid
tests (see next presentations).
The setting up of a test of Grid processing of variable star data was
described.
Although this was not the first Grid experiment (the first was with
astrometric binaries), this was the first large-scale GaiaGrid test with 10
million stars.
It was decided that since this was a simple test, it was
more efficient to do the simulations ourselves rather than go through the
SWG.
At the January SWG meeting in Leiden it was decided what was required.
The simulated data generated by DE was described along with the
Grid infrastructure.
The current idea is that if you have an algorithm you provide a
machine so that it can be integrated easily into the Grid.
To see the current algorithms you can go to
gaia.esa.int/algorithms/
The data is prepared for the Grid
by chopping it into sections so that it can be processed in parallel by
the 38 nodes available.
Using the workflow tool the logical order of the various tasks (reading in
the data, followed by splitting and processing the data and then writing out
the results) is set up.
Note that the workflow tool only allows tasks that match to
be placed next to each other.
The results and conclusions were presented.
The time to process 100,000 stars was around 12 hours. Some certificate
problems were encountered.
Using flat files, rather than using a database management system, was found
to be effective.
The next steps were listed.
More details can be found in the paper GAIA-GRID-001.
Comments/discussion
DE - What percentage of processing time was used by the
period search in comparison to variability detection?
SA - This was not looked at.
DE - Suggested that this is added to the paper as an appendix.
This presentation is also part of the paper GAIA-GRID-001 and covered the
variability tests.
The principle of p-values were described with the main objective being to
minimize false positives. However, they can also be
used to adjust the error estimates. The current tests show that there are
problems with the skewness and kurtosis p-value estimators.
Not much could be said about the period comparison due to the limited nature
of the simulations, however they did show a
problem with the eclipsing binary sample where the periods could be wrong by
a factor of 2 or 3.
Comments/discussion
PB or GB? - Have any tests been carried out on multiperiodic variables?
DE - This will be done in the future. Semi-regulars and
irregulars are likely to be the majority of variables
Many period search methods exist and a list of relevant publications was
shown (this can also be seen on our web pages
here). There is a
need to compare these methods.
An email request went out on 18 April 2005 and a number of people have
agreed to help.
Mathias Beck will generate the simulations for this which were then described.
A number of format issues were discussed. DP wanted a single file containing
all stars and that there be no header just ID, time, magnitude and error
ie. all lines are in the same format. This was agreed.
Comments/discussion
DP - a philosophical query - "Why are we discussing this?". This is supposed
to be a blind test.
It was generally thought that some open guidance was
reasonable.
DE - Semi-regular variables will be missing from the simulations
All - Agreed
PO - Perhaps MACHO data could be used (LE - or EROS data)
Possible problems with gaps
LE - How do we simulate eclipsing binaries?
AR - Suggested Arenou for possible code
DP - Suggested Zwitter or Munari
LE - He had already contacted these
DP - Will 5000 for each category be enough considering the variation of
different types?
5000 will be OK to start off with.
FM - pointed out that you won't have a true period for the Hipparcos data
There was no dissent regarding this plan :)
Variability detection is closely linked to instrumental stability. The variation in a flux measurement is a combination of the intrinsic variability of the object and that due to the instrument. If the flux of an object is constant then you can determine the variation of the instrument. Thus, you can use the mean behaviour to characterize the instrument, remove this variation and then determine the variability due to the object.
Comments/discussion
DE - There is a strong need to coordinate how the reductions are organized
between CU3 and CU5 on this issue.
There followed some discussion on how cosmic rays might influence this
process.
Hipparcos, OGLE, MACHO, EROS and ASAS had no fully automatic global
classification. Gaia will need full automation.
Recent studies were described. In
Eyer & Blake (Bayesian classifier) there was about a 7% error. This may be
acceptable for ASAS data but not Gaia.
For Self Organizing Maps see Vasily Belokurov's
website,
although an assessment of error levels is needed.
Naud & Eyer have also done work on SOMs.
Work on Support Vector Machines was described (Willemsen & Eyer).
Future work was listed including the need for some benchmark tests on
classification.
Comments/discussion
SA - Hipparcos had limited data - how do you add additional information
(more photometry, RVS, parallax etc.)?
DP - Perhaps distinctions between variable types are not real
and that there are not really 50 different types, but say 10.
PO - You will also get extra-galactic objects that are variable.
LE - The Fourier envelope characterization used in the SOM work will be
affected by Gaia sampling.
DE - Said he would initiate a study on this
Long period variables will be very difficult to observe with Gaia since
(a) the colour corrections will be large and variable (b) they have large
radii so will be resolved (c) they have profile asymmetries that vary with
time so could affect the parallax measurements.
Variability Induced Movers are a consequence of not accounting for (a).
The case of Betelgeuse was described. It has surface features, but its
V-I of 2.3 shows no variation. The
Hipparcos double star indicator gives a result that is higher than expected
for its resolved radius. Could it be
binary? Probably not.
Showed that M2/M1 is a function of colour for very bright objects.
The relevance for Gaia is that photocentres will move, which will be a
problem for parallax measurements if the timescale is around 1 year.
Comments/discussion
FM - Pointed out that there was not enough calibration at the very red end for
Hipparcos
DE - This could also be a bright end problem for the Hipparcos calibrations
AR - Is this sort of thing needed in the simulations?
The general feeling was that this was a level of detail
that was not required at the moment
This presentation considered the possibility of detecting an evolutionary
change in a star over the length of the mission. Two cases were described for
the late phases of low mass stars.
AGB stars will change brightness by a factor of 2 over 300 years and
thus could be observed. 1 in 200 AGB stars
will be in this phase.
For Planetary Nebulae it is unclear if this would be detectable by Gaia.
There is a change of 0.001 mag/year for MC=0.6M⊙.
Future work was described.
Comments/discussion
DP - Would we be able to detect colour evolution?
A general description of the use of Principal Component Analysis was given.
It was pointed out that not just the largest eigenvalue is useful -
the smallest for example gives the intrinsic noise in the system.
The ratio R=νn/ν1 will be
useful for variability detection since it will be large if there is
a correlation.
A more stable and robust definition may be
R=(νn+νn-1)/
(ν1+ν2+ν3).
It will also be possible to use the eigenvalue vectors as a function of
wavelength as a variability classifier.
Comments/discussion
DE - Can this be done in a cumulative manner?
LE said that it could
We were reminded that with regular sampling aliasing occurs and that with random sampling you get no aliasing at all, but what about semi-regular sampling as with Hipparcos or Gaia? For irregular sampling, a set of conditions were presented for which if there is no solution, then there will be no aliasing. Thus for pseudo-regular sampling it is possible to do better than the minimum difference if there is no common factor in the intervals. For Gaia sampling we can get better than the smallest interval of 100 minutes and very small periods can be recovered.
Comments/discussion
DP - How far can it go? Will there be other peaks at higher frequencies?
Fourier analysis has been a standard method to analyse periodic signals for
a long time and is well adapted to regular sampling, however
aliasing is a problem.
Assumptions are needed to remove the degeneracies.
An advantage for
regular sampling is that there are no spurious lines outside the true
lines.
For irregular sampling there are
many ghost lines, but no strong repeat patterns in frequency space.
FAMOUS uses a sinusoidal model to fit to the data with the amplitude
coefficients being either constant or a time polynomial.
Many features of the programme were described.
For a multi-periodic signal, once
a frequency has been identified, you fit a model (non-linear least-squares)
and remove it from the signal. This is then repeated.
Any new line found in the residual
signal is orthogonal to the previous lines -
this gets rid of ghost lines and makes the detection of each new frequency
easier.
The current version of the programme consists of 8000 lines of f90 code and
can be configured by the user in some detail.
Examples were shown and compared with the results from a standard FFT analysis.
Also errors on the period and amplitude are generated by FAMOUS.
An example of Gaia sampling was shown demonstrating the
sequentially removing of lines.
Tests have been carried out on 2500 Hipparcos periodic variables (CPU time
is 0.18s/star on a laptop - this has now been improved to 0.12s/star).
Conclusions and future work were
listed along with where you can download software (& simulator)
- ftp://ftp.obs-nice.fr/pub/mignard/Famous
Comments/discussion
PB - Why do you need a window function?
The work packages for the VSWG were listed.
The importance of scientific participation was stressed and that
Gaia should keep a scientific working group
on variability - this point also applies to other working groups.
The LoI for Geneva was described.
A concern was expressed that the responsibility will be too dispersed
and that those who are really doing the work would not have much visibility.
A synthesis of the 162 LoIs was presented.
The major coordinated answers were:
Cambridge - photometry
Cambridge & Geneva - Science Alerts
ARI - First look, bright stars
CNES - simulations, data analysis, system architecture
Italy - quality control & validation
International (coordinated by Meudon) - RVS
SSWG - solar system objects
For variability there were 6 collective responses and 11
individual ones. The areas covered were detection, light curve analysis,
period detection, classification, follow-up and science alerts.
Areas not much covered were simulations and overall management.
Some FTE statistics on the above were shown.
Comments/discussion
MG - What is the next step?
FM - The answers will be given in the next talk.
This presentation gave information about decisions made by the GST and DACC
concerning the data processing of the Gaia data.
The size of the problem and nature of the challenge were described.
It was pointed out that the data reductions will
not be funded by ESA nor will they be organized by them. Obviously,
the structure for the data reductions
must be ready by launch time, so a hard deadline is in place.
The basic organization does not exist yet and it will not be based on
the working group structure. Note that
science will not be the primary activity in the data processing groups. The
structure that will be devised must be simple,
hierarchical and have non-overlapping responsibilities.
Also the GST should retain control of the data processing.
The current hierarchical structure is:
Data Analysis Consortium (DAC) - Coordinating Unit (CU) - Development Unit
(DU) - Work Package (WP). Note that
not every CU will have hardware, but they will be responsible for the
end result. The
CU concept was then described in further detail and the
leaders & co-leaders of the provisional list given.
The DU concept was also described, but this is not as well defined as that
for the CUs.
Flowcharts for the data flow were shown.
When the DACC has worked out the structure it will then be replaced by
the Data Analysis Consortium Executive (DACE).
Note that the AO will be issued to formalize the structure and will not be
competitive. This will happen early next year.
The composition of the DACC was described.
The next steps in this process:
The CUs make WP list
Data flow constraints are analysed
The CUs construct the DUs
The next DACC meeting will be 6-7 October Heidelberg
Comments/discussion
DP - Classification is part of CU4, but a lot of variability analysis is
classification. So is variability in CU4 or CU5? Where do you want it?
DE&FM&CB - The responsibility lies with the DACC not
the VSWG.
DE suggested that he and LE send the VSWG WPs to DP and FvL to decide what
to do. Then DP and FvL send proposals back to DE and LE so they can be
checked to see if things have not fallen by the wayside. DE said that some
of the VSWG work packages may remain with the VSWG since they are science
based.
Laurent Eyer closed the meeting at 18:55.
MB - generate simulations for period search benchmark tests.
Various - perform period search benchmark tests
DE - investigate how the Fourier envelope characterization used in the SOM work will be affected by Gaia sampling.
LE & DE - send the VSWG WP list to DP and Fvl for inclusion into the CU4 and CU5 plans.
| SA | Salim Ansari |
| CB | Carine Babusiaux |
| PB | Paul Bartholdi |
| MB | Mathias Beck |
| GB | Gilbert Burki |
| Merieme Chadid | |
| Marc Cherix | |
| Francesca De Angeli | |
| DE | Dafydd Wyn Evans |
| LE | Laurent Eyer |
| MG | Michel Grenon |
| Philippe Mathias | |
| Nami Mowlavi | |
| FM | François Mignard |
| PO | Patricio Ortiz |
| Dimitri Pourbaix | |
| Celine Reyle | |
| Reiner Rohlfs | |
| AR | Annie Robin |
| Eric Slezak |
Minutes taken by Dafydd Wyn Evans 25 July 2005, slight modifications by L.Eyer, 30 August 2005